Pro Kapital Council approved Consolidated Interim Report for IV Quarter and 12 Months of 2021 (Unaudited)
March 1, 2022
MANAGEMENT REPORT
Chairman’s summary
The fourth quarter of 2021 has confirmed the positive trend seen in the previous quarter. The overall market is healthy and we are seeing a solid and steady demand for our projects. The construction market still poses some challenging issues, mainly due to complications related to Covid-19 and relative problems in the supply chain, and an increase in the cost of materials due to lower overall supply, which makes it harder to fix a price for the works with the construction companies.
Real estate development
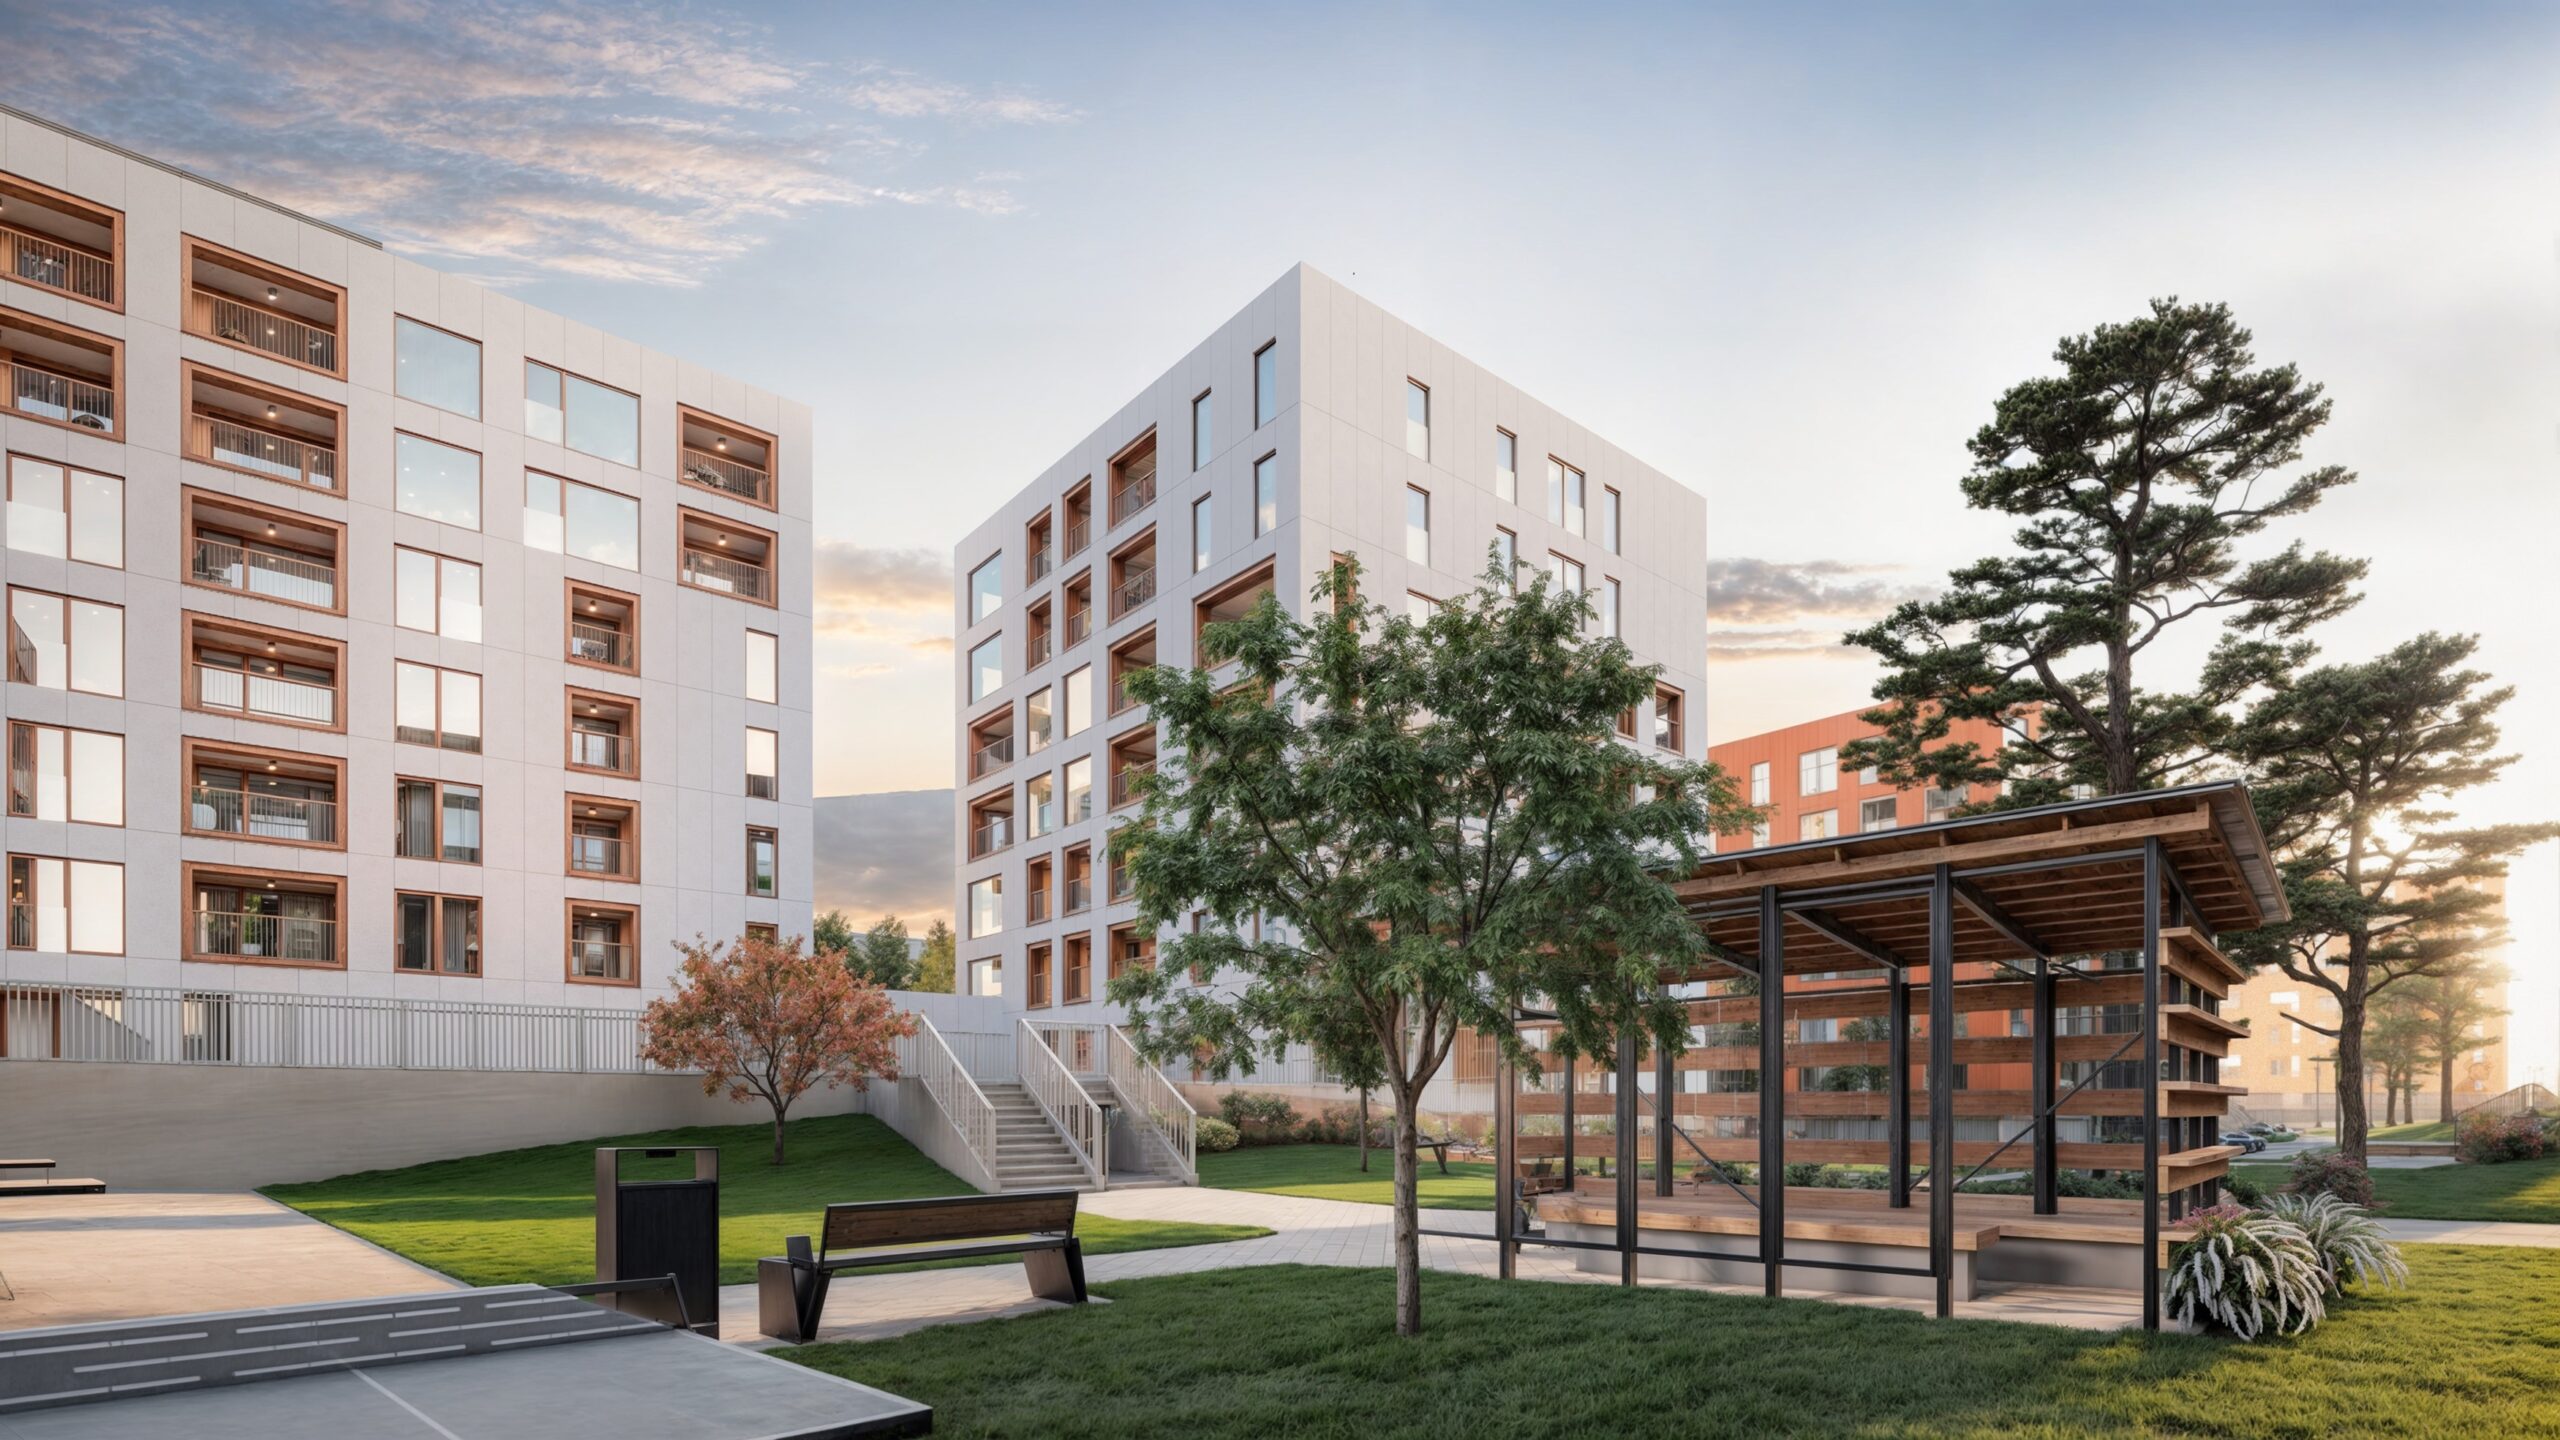
In Tallinn, we have continued the construction of Kindrali Houses and Kalaranna projects. In the third quarter of 2021 we started handing over apartments in Kalaranna project, where completion of eight buildings with a total of 240 apartments will be achieved. Today we are handing over apartments in the fifth and sixth building and we have reservations or presales concluded for all business premises and for 99% of apartments in this phase of the project. Last year we started construction of the new project Kindrali Houses in Kristiine City, where three building complexes with the total of 195 apartments will be raised. In this project, we had booked or presold more than half of the apartments before signing the construction agreement. Today we have no apartment available in Kindrali.
In Riga we are selling our ready luxury product River Breeze Residence and started the tendering process for the further development of Kliversala Residential Quarter – Blue Marine. We have invited several construction companies to the tender and are in the process of identifying the best option, subject to the offers we will receive. Latvian real estate sector is lagging its’ neighboring countries (Estonia and Lithuania) due to what we see as contingent reasons that will have little impact on our long-term value creation strategy. However, it is undeniable that the market is currently moving at a slower pace compared to the other Baltic Republics. This comes with some short-term challenges, but we believe that this untapped potential could also be favorable should we decide to expand our land portfolio in the area, by giving us the chance to buy at a lower price relative to the other Baltic capitals.
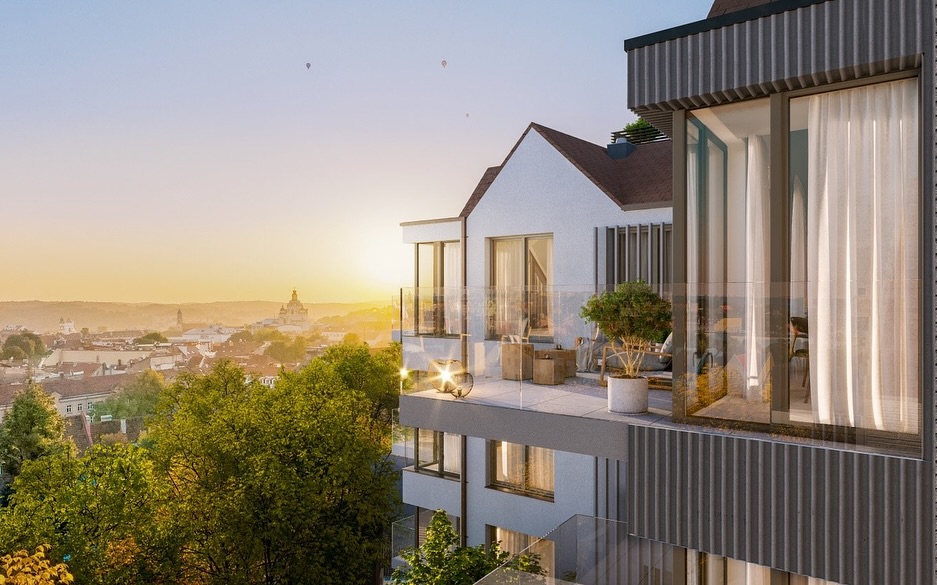
In Vilnius, we only have 4 unsold apartments in our Šaltiniu Namai Attico project. The real estate market has had a great run in 2021 and we saw a great deal of interest for our luxury properties, achieving some of the highest prices per sq.m2 in all the local market. We just started the tendering process for the following phase of city villas and a commercial building and we can start construction works this summer.
Hotel operations
The Covid-19 pandemic had a strong impact on all the tourism sector, but luckily the German government has provided a great deal of support in terms of subsidies provided to PK Parkhotel Kurhaus in Bad Kreuznach.
The current restrictions are still based on the “2G+ model”, meaning that all the hotel guests who have 2 doses of vaccines still must present daily negative Covid tests. This clearly complicates the job of selling rooms and we decided to turn this problem into an opportunity, by speeding up the process of renovation of the second half of the rooms (first half has been renovated 5 years ago), doing works in a period where we will not disturb our guests due to the lower occupation of the hotel.
The works will also have the added benefit of converting an unused area into 7 standard rooms and creation of a luxurious suite with a private sauna and terrace, which will greatly improve the overall prestige of the hotel.
In the following months, we plan on continuing the construction works of ongoing developments and preparing for the upcoming phases. The real estate development is going well, the market is strong and we will continue implementing our strategy of creating long-term value for our shareholders and for the communities that we aim to develop in a sustainable, comfortable, and aesthetically pleasing way.
Edoardo Preatoni
CEO
Key financials
The total revenue of the Company in of 2021 was 44.8 million euros, having increased by 133% compared to the reference period (2020 12M: 19.2 million euros). The total revenue of the fourth quarter was 23.7 million euros, which is 4.23 times more than
5.6 million euros during the same period in 2020.
The real estate sales revenues are recorded at the moment of handing over the premises to the buyer. Therefore, the revenues from sales of real estate depend on the completion of the residential developments. The real estate sales have been influenced by completion of Ratsuri Houses project, where all apartments were sold and handed over to new owners and start of handing over apartments in first buildings of Kalaranna project. The Company has continued with sales of completed developments – River Breeze Residence in Riga and Šaltinių Namai Attico development in Vilnius and with presales of ongoing development projects Kalaranna District and Kindrali Houses in Tallinn.
The gross profit in 2021 increased by 69% amounting to 11.4 million euros compared to 6.8 million euros in 2020. In the fourth quarter, the gross profit figures were 5.3 million euros and 1.4 million euros respectively.
The operating result in 2021 has improved to 12.4 million euros profit compared to 43.1 million euros loss during the same period in 2020. The operating result of the fourth quarter was 8.7 million euros profit compared to 1.1 million euros loss in 2020.
The net result in 2021 was 29.8 million euros profit and in the fourth quarter 7.3 million euros profit, compared to losses of 59.5 million euros and 48.4 million euros in the reference periods respectively. While the results of the reference period 2020 were influenced by the decrease in the value of investment property in the subsidiary AS Tallinna Moekombinaat, the positive results of the reporting period reflect the positive effect of loss of control and derecognition of the above-mentioned subsidiary as well as increased sales revenues from property developments in Estonia.
Cash generated from operating activities during 2021 was 13.3 million euros compared to 7.7 million euros used during the same period in 2020. In the fourth quarter of 2021 cash generated from operating activities was 11.9 million euros and 3.1 million euros were used during the same period in 2020.
Net assets per share on 31 December 2021 totaled 0.76 euros compared to 0.17 euros on 31 December 2020.
Key performance indicators (including discontinued operations)
| 2021 12M | 2020 12M | 2021 Q4 | 2020 Q4 | |
| Revenue, th EUR | 44 830 | 19 234 | 23 722 | 5 619 |
| Gross profit, th EUR | 11 424 | 6 775 | 5 321 | 1 404 |
| Gross profit, % | 25% | 35% | 22% | 25% |
| Operating result, th EUR | 12 380 | -43 108 | 8 666 | -44 244 |
| Operating result, % | 28% | -224% | 37% | -787% |
| Net result, th EUR | 29 757 | -59 456 | 7 292 | -48 371 |
| Net result, % | 66% | -309% | 31% | -861% |
| Earnings per share, EUR | 0.52 | -0.98 | 0.13 | -0.79 |
| 31.12.2021 | 31.12.2020 | |
| Total Assets, th EUR | 116 027 | 179 048 |
| Total Liabilities, th EUR | 73 184 | 169 477 |
| Total Equity, th EUR | 42 843 | 9 571 |
| Debt / Equity * | 1.71 | 14.15 |
| Return on Assets, % ** | 20.2% | -30.7% |
| Return on Equity, % *** | 113.5 | -141.2% |
| Net asset value per share, EUR **** | 0.76 | 0.23 |
*debt / equity = total debt / total equity
**return on assets = net profit/loss / total average assets
***return on equity = net profit/loss / total average equity
****net asset value per share = net equity / number of shares
CONSOLIDATED FINANCIAL STATEMENTS
Consolidated interim statement of financial position
| in thousands of euros | 31.12.2021 | 31.12.2020 |
| ASSETS | ||
| Current assets | ||
| Cash and cash equivalents | 9 626 | 9 393 |
| Current receivables | 802 | 1 797 |
| Inventories | 57 533 | 58 352 |
| Total current assets | 67 961 | 69 542 |
| Non-current assets | ||
| Non-current receivables | 21 | 3 517 |
| Property, plant and equipment | 6 754 | 6 745 |
| Right-of-use assets | 202 | 357 |
| Investment property | 40 734 | 98 512 |
| Intangible assets | 355 | 375 |
| Total non-current assets | 48 066 | 109 506 |
| TOTAL ASSETS | 116 027 | 179 048 |
| LIABILITIES AND EQUITY | ||
| Current liabilities | ||
| Current debt | 3 955 | 107 581 |
| Customer advances | 12 419 | 7 866 |
| Current payables | 4 379 | 22 211 |
| Tax liabilities | 1 144 | 458 |
| Short-term provisions | 1 125 | 459 |
| Total current liabilities | 23 022 | 138 575 |
| Non-current liabilities | ||
| Long-term debt | 46 455 | 27 255 |
| Other non-current payables | 2 526 | 2 295 |
| Deferred income tax liabilities | 1 133 | 1 170 |
| Long-term provisions | 48 | 182 |
| Total non-current liabilities | 50 162 | 30 902 |
| TOTAL LIABILITIES | 73 184 | 169 477 |
| Equity attributable to owners of the Company | ||
| Share capital in nominal value | 11 338 | 11 338 |
| Share premium | 5 661 | 5 661 |
| Statutory reserve | 1 134 | 1 134 |
| Revaluation reserve | 2 984 | 2 984 |
| Retained earnings | -8 031 | 47 647 |
| Profit/ Loss for the period | 29 757 | -55 678 |
| Total equity attributable to owners of the Company | 42 843 | 13 086 |
| Non-controlling interest | 0 | -3 515 |
| TOTAL EQUITY | 42 843 | 9 571 |
| TOTAL LIABILITIES AND EQUITY | 116 027 | 179 048 |
* See Note 2 for details regarding restatement.
Consolidated interim statements of profit and loss and other comprehensive income
| in thousands of euros | 2021 12M |
2020 12M | 2021 Q4 |
2020 Q4 |
| CONTINUING OPERATIONS | ||||
| Operating income | ||||
| Revenue | 43 095 | 13 637 | 23 722 | 4 894 |
| Cost of goods sold | -32 519 | -9 424 | -18 401 | -3 386 |
| Gross profit | 10 576 | 4 213 | 5 321 | 1 508 |
| Marketing expenses | -502 | -610 | -144 | -193 |
| Administrative expenses | -5 592 | -4 372 | -2 043 | -1 201 |
| Other income | 7 654 | 384 | 5 541 | 358 |
| Other expenses | -63 | 2 876 | -9 | 2 891 |
| Operating profit/ loss | 12 073 | 2 491 | 8 666 | 3 363 |
| Financial income | 53 813 | 4 | 1 | 1 |
| Financial expense | -30 882 | -5 420 | -1 408 | -1 327 |
| Profit / loss before income tax | 35 004 | -2 925 | 7 259 | 2 037 |
| Income tax | 10 | -354 | 33 | -143 |
| Net profit / loss from continuing operations | 35 014 | -3 279 | 7 292 | 1 894 |
| Profit from discontinued operations | -5 257 | -56 177 | 0 | -50 265 |
| Net profit / loss for the period | 29 757 | -59 456 | 7 292 | -48 371 |
| Attributable to: | ||||
| Equity holders of the parent | 29 757 | -55 678 | 7 292 | -45 005 |
| Non-controlling interest | 0 | -3 778 | 0 | -3 366 |
| Other comprehensive income, net of income tax | ||||
| Items that will not be reclassified subsequently to profit or loss | ||||
| Net change in properties revaluation reserve | 0 | -278 | 0 | 0 |
| Total comprehensive income / loss for the year | 29 757 | -59 734 | 7 292 | -48 371 |
| Attributable to: | ||||
| Equity holders of the parent | 29 757 | -55 956 | 7 292 | -45 005 |
| Non-controlling interest | 0 | -3 778 | 0 | -3 366 |
| Earnings per share (continuing operations) € | 0.62 | -0.06 | 0.13 | 0.03 |
| Earnings per share for the period € | 0.52 | -0.99 | 0.13 | -0.79 |
Consolidated interim statements of cash flows
| in thousands of euros | 2021 12M | 2020 12M | 2021 Q4 | 2020 Q4 |
| Cash flows from operating activities | ||||
| Profit/loss for the period | 29 757 | -59 456 | 7 302 | -48 373 |
| Adjustments for: | ||||
| Depreciation, amortisation of non-current assets | 374 | 416 | 92 | 105 |
| Gain from disposal of investment property | -1 092 | 0 | 0 | 0 |
| Loss from write-off of plant, property, equipment | 0 | 8 | 0 | 8 |
| Change in fair value of property, plant, equipment | -56 | -16 | -56 | -16 |
| Change in fair value of investment property | -5 484 | 43 127 | -5 484 | 43 127 |
| Gain from derecognition of subsidiary | -53 808 | 0 | 0 | 0 |
| Finance income and costs | 36 440 | 15 994 | 1 407 | 3 984 |
| Changes in deferred tax assets and liabilities | -37 | -178 | 0 | -60 |
| Other non-monetary changes (net amounts) | 1 536 | -3 110 | -7 | 14 |
| Changes in working capital: | ||||
| Trade receivables and prepayments | 4 492 | -1 514 | 686 | 535 |
| Inventories | 818 | -13 011 | 10 278 | -636 |
| Liabilities and prepayments | 477 | 10 025 | -2 323 | -1 845 |
| Provisions | -127 | 59 | 12 | 31 |
| Net cash used in operating activities | 13 290 | -7 656 | 11 907 | -3 126 |
| Cash flows from investing activities | ||||
| Payments for property, plant and equipment | -178 | -94 | -76 | -71 |
| Payments for intangible assets | -20 | -43 | -8 | -45 |
| Payments for investment property | -458 | -844 | -48 | -187 |
| Proceeds from disposal of investment property | 2 000 | 0 | 0 | 0 |
| Change in cash from derecognition of subsidiary | -182 | 0 | 0 | 0 |
| Interests received | 3 | 1 | 0 | 0 |
| Net cash used in investing activities | 1 165 | -980 | -132 | -303 |
| Cash flows from financing activities | ||||
| Net proceeds from secured bonds | 0 | 28 500 | 0 | 0 |
| Redemption of convertible bonds | -337 | -33 | 0 | -30 |
| Repurchase of non-convertible bonds | 0 | -28 000 | 0 | 0 |
| Proceeds from borrowings | 22 340 | 14 410 | 3 843 | 6 721 |
| Repayment of borrowings | -30 581 | -1 376 | -18 726 | -692 |
| Repayment of lease liabilities | -163 | -135 | -34 | -5 |
| Interests paid | -5 481 | -5 953 | -515 | -488 |
| Net cash used/ generated by financing activities | -14 222 | 7 413 | -15 432 | 5 506 |
| Net change in cash and cash equivalents | 233 | -1 223 | -3 657 | 2 077 |
| Cash and cash equivalents at the beginning | 9 393 | 10 616 | 13 283 | 7 316 |
| Cash and cash equivalents at the end of the period | 9 626 | 9 393 | 9 626 | 9 393 |
The full report can be found in the stock exchange announcement.
