Pro Kapital Council approved Consolidated Interim Report for II Quarter and 6 Months of 2021 (Unaudited)
August 13, 2021
MANAGEMENT REPORT
CEO summary
2021 has been a dynamic working period. We have continued with our ongoing developments, where we see remarkable results, but also had to face a setback as the decision of the Supreme Court terminated reorganisation proceedings of our subsidiary AS Tallinna Moekombinaat which led to the permanent insolvency and loss of control of the subsidiary.
Real estate development
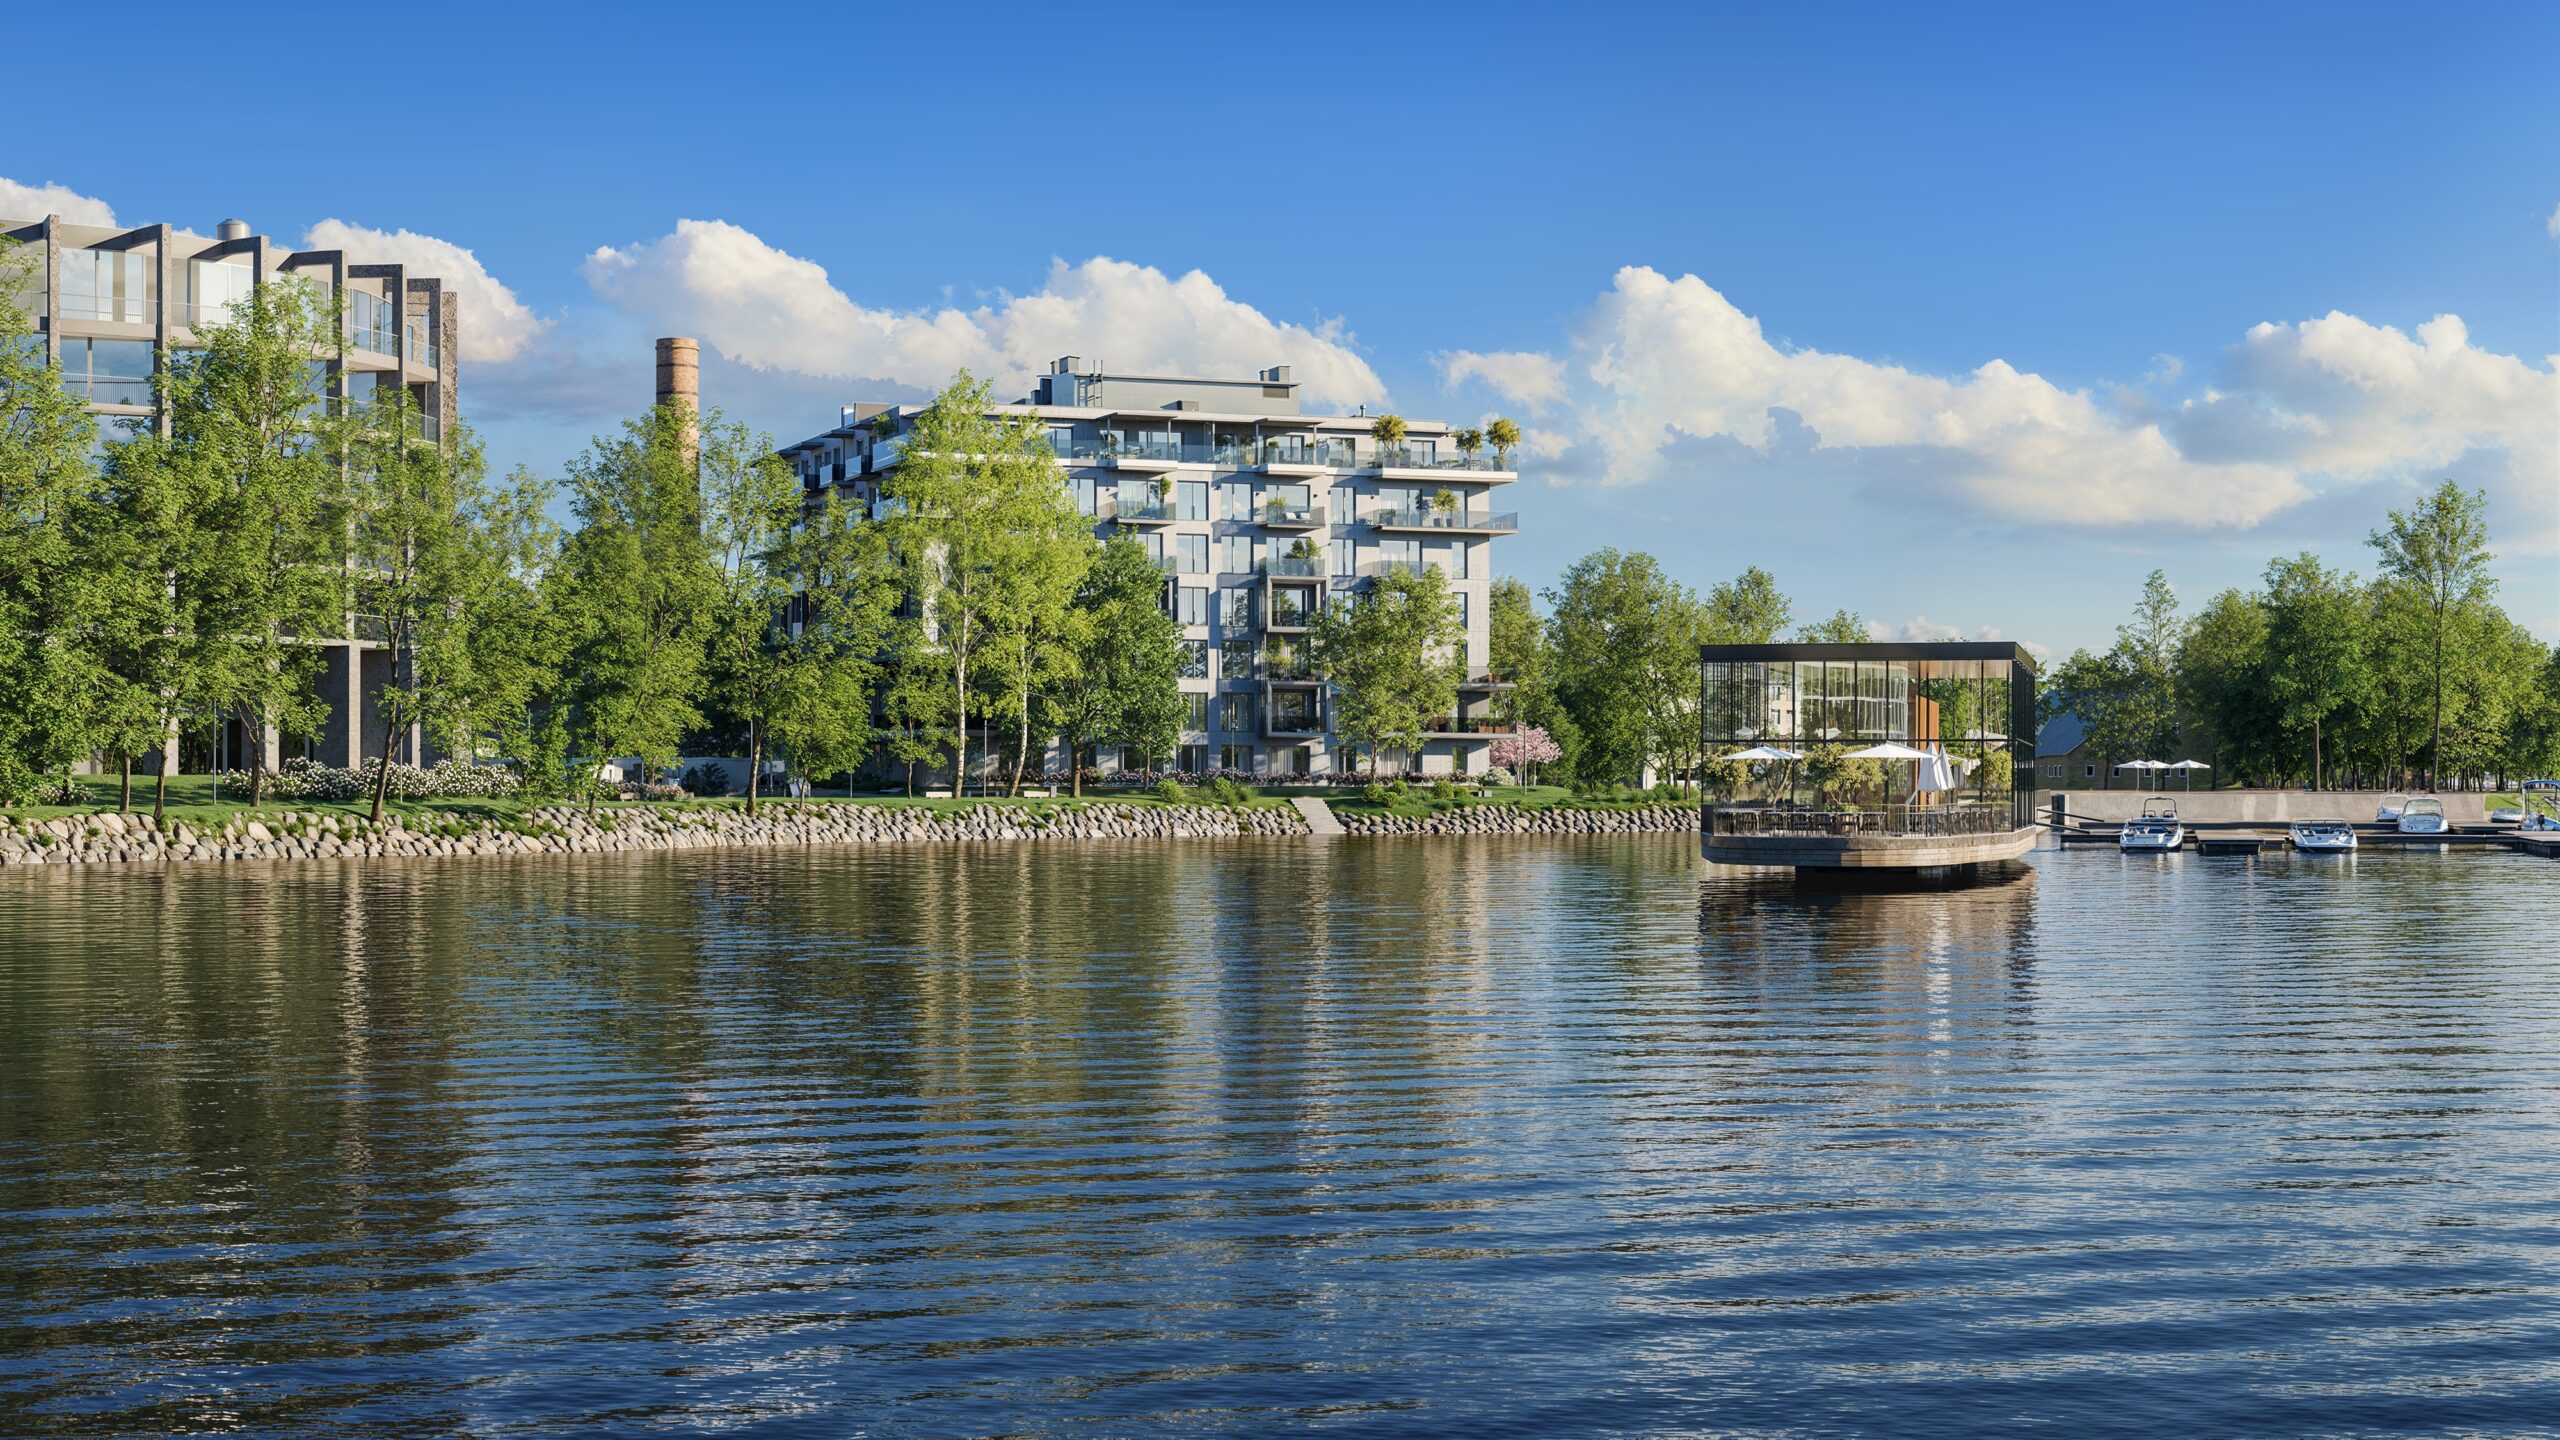
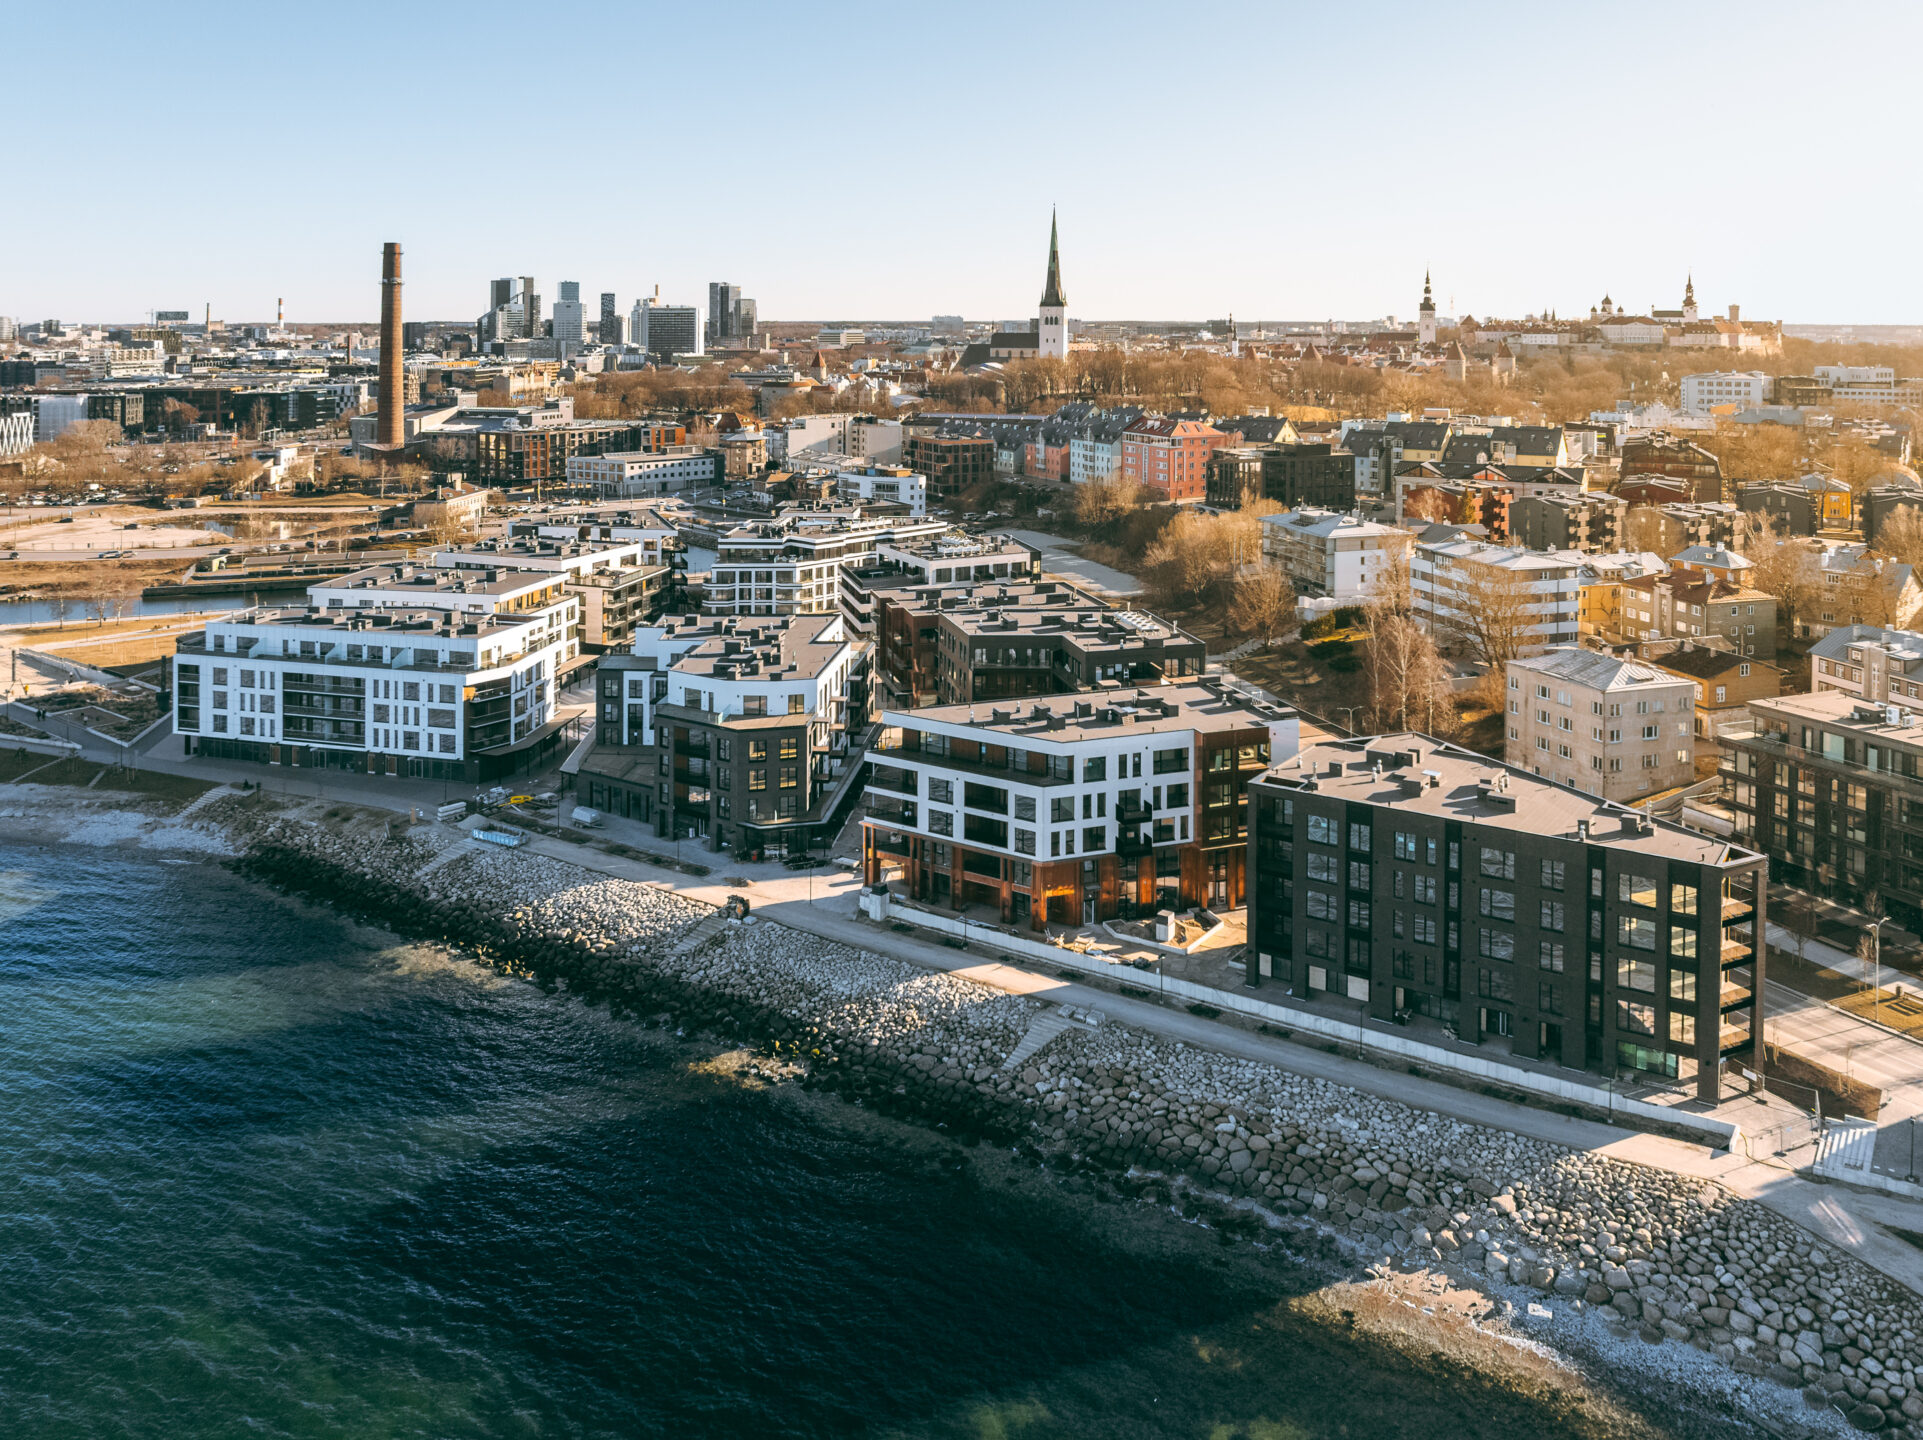
We have continued construction of Kindrali Houses and Kalaranna projects and preparing project documentation for the following development phases in Tallinn. In March we completed Ratsuri Houses in Kristiine City where we had booked or presold all 39 apartments already prior to the completion. All apartments were sold and handed over within March and April. Soon we start handing over apartments in two first buildings of Kalaranna project, where completion of eight buildings with the total of 240 apartments will be achieved step by step in four phases. Today we have reservations or presales concluded for 88% of premises. This spring we concluded an agreement for sales of all business premises of Kalaranna project for 16.16 million euros (with VAT) including the option to sell also premises of the last phase, which we are preparing to launch in the near future. This year we started with the construction of the new project Kindrali Houses in Kristiine City, where two building complexes with 129 apartments will be raised by next summer. In this project, we had booked or presold more than half of the apartments before signing the construction agreement. Based on strong demand of our product we initiated also the construction of the third building in this project with additional 66 apartments, which will be completed in the first quarter of 2023. Today over 82% of the apartments have been booked or presold in Kindrali.
In Riga we are selling our luxury product River Breeze Residence and prepare for the further development of Kliversala Residential Quarter. We have received a building permit for City Oasis residential quarter with 326 apartments – a tranquil and green living environment in the city centre. We are ready to proceed with construction activities as soon as the market situation becomes more favourable. Unfortunately, the Latvian real-estate market has not been as active as its neighboring countries Estonia and Lithuania. However, we are observing some changes and recovery of the market.
In 2019 we completed five buildings in Šaltinių Namai Attico project in Vilnius with 115 apartments. Today we have only 5 apartments unsold. We are preparing for the following phase with city villas and commercial building and plan to start the construction this year.
Our revenues from the sales of the real estate depend on the completion of the residential developments as the revenues are recorded at the moment notary deeds of sale are concluded. In 2021 we have already completed Ratsuri Houses project with 39 apartments and now we start handing over exclusive homes in a prime location of Kalaranna project.
T1 Mall of Tallinn
On 3 April 2020 Harju County Court initiated reorganization proceedings of the operator of T1 Mall of Tallinn – AS Tallinna Moekombinaat (TMK). Reorganization proceedings were terminated a year later by the decision of 26 April 2021 of the Supreme Court not to take TMK’s appeal into proceedings. Without the reorganization proceedings AS Tallinna Moekombinaat is not capable to fulfil its obligations and has become permanently insolvent. On 2 June 2021 Harju County Court declared bankruptcy of AS Tallinna Moekombinaat and the Company lost control over the subsidiary. AS Pro Kapital Eesti had written off investment into a subsidiary in the amount of 13.4 million euros due to negative equity of TMK and as a result of adjusting event also receivables in the total amount of 26 million euros as at 31 December 2020 in its standalone reports. When the bankruptcy was declared and the Company lost control over the subsidiary, the subsidiary was derecognised in consolidated financial statements and write-off took effect in the second quarter. Although write-off influenced consolidated results negatively, discontinuing consolidation had a positive effect on the Group financial results due to derecognition of negative equity of the subsidiary (Note 15).
Hotel operations
Last year had a significant impact on PK Parkhotel Kurhaus in Bad Kreuznach, Germany. Due to the COVID-19 restrictions, the hotel was closed from March until the end of June and due to new restrictions hotel is not operating since November 2020. The impact of COVID-19 has been 0.6 million euros in fewer hotel revenues in the first six months of 2021 comparing to last year. However, due to governmental support, the net result was better by 208 thousand euros. We reopened the hotel in the middle of June.
In the following months, we continue construction works of ongoing development projects and plan to start with the following phases. In spite of losing T1 Mall of Tallinn, our real estate development is doing well, the Company is a going concern and we have an optimistic view for the future.
Paolo Michelozzi
CEO
Key financials
The total revenue of the Company in the first six months of 2021 was 9 million euros, which is a slight decrease of 11 thousand euros compared to the reference period (2021 6M: 9.1 million euros). The total revenue of the second quarter was 2.5 million euros, a decrease of 22% compared to 3.2 million euros during the same period in 2020. The real estate sales revenues are recorded at the moment of handing over the premises to the buyer. Therefore, the revenues from sales of real estate depend on the completion of the residential developments. The real estate sales have been influenced by the completion of Ratsuri Houses project, where all apartments were sold and handed over to new owners. In 2021, the Company has continued with sales of completed developments – River Breeze Residence in Riga and Šaltinių Namai Attico development in Vilnius and presales of ongoing development projects: first phases of Kalaranna District and Kindrali Houses in Tallinn.
The gross profit in the first six months of 2021 decreased by 24% amounting to 2.7 million euros compared to 3.5 million euros during the same period in 2020. In the second quarter, the gross profit figures were 0.7 million euros and 1.4 million euros respectively.
The operating result in the first six months of 2021 was 0.9 million euros profit comparing to 0.3 million euros profit during the same period in 2020. The operating result of the second quarter was 1.0 million euros loss comparing to 94 thousand euros loss in 2020.
The net result in the first six months of 2021 was 21.3 million euros profit and in the second quarter 23.5 million euros profit. In the comparable period the net results were 7.9 million euros loss and 3.9 million euros loss respectively. The net result of the reporting period was influenced by loss of control and derecognition of the subsidiary AS Tallinna Moekombinaat.
Cash used in operating activities during the first six months was -3.9 million euros comparing to -2.6 million euros during the same period in 2020. In the second quarter of 2021 cash used in operating activities were -5.2 million euros and -4.6 million euros generated during the same period in 2020.
Net assets per share on 30 June 2021 totaled to 0.61 euros compared to 1.12 euros on 30 June 2020.
Key performance indicators (including discontinued operations)
| 2021 6M | 2020 6M | 2021 Q2 | 2020 Q2 | 2020 12M | |
| Revenue, th EUR | 9 042 | 9 053 | 2 479 | 3 180 | 19 234 |
| Gross profit, th EUR | 2 661 | 3 491 | 687 | 1 354 | 6 775 |
| Gross profit, % | 29% | 39% | 28% | 43% | 35% |
| Operating result, th EUR | 877 | 250 | -1 020 | -96 | -43 108 |
| Operating result, % | 10% | 3% | -41% | -3% | -224% |
| Net result, th EUR | 21 342 | -7 903 | 23 454 | -3 935 | -59 456 |
| Net result, % | 236% | -87% | 946% | -124% | -309% |
| Earnings per share, EUR | 0.38 | -0.13 | 0.42 | -0.07 | -0.98 |
| 30.06.2021 | 30.06.2020 | 31.12.2020 | |
| Total Assets, th EUR | 125 105 | 210 575 | 179 048 |
| Total Liabilities, th EUR | 90 677 | 149 173 | 169 477 |
| Total Equity, th EUR | 34 428 | 61 402 | 9 571 |
| Debt / Equity * | 4.00 | 2.17 | 14.15 |
| Return on Assets, % ** | 14% | -4% | -30.7% |
| Return on Equity, % *** | 97% | -12% | -141.2% |
| Net asset value per share, EUR **** | 0.61 | 1.11 | 0.23 |
*debt / equity = total debt / total equity
**return on assets = net profit/loss / total average assets
***return on equity = net profit/loss / total average equity
****net asset value per share = net equity / number of shares
CONSOLIDATED FINANCIAL STATEMENTS
Consolidated interim statement of financial position
| in thousands of euros | 30.06.2021 | 30.06.2020 Restated |
31.12.2020 |
| ASSETS | |||
| Current assets | |||
| Cash and cash equivalents | 13 842 | 7 061 | 9 393 |
| Current receivables | 967 | 1 077 | 1 797 |
| Inventories | 67 967 | 45 381 | 58 352 |
| Total current assets | 82 776 | 53 519 | 69 542 |
| Non-current assets | |||
| Non-current receivables | 23 | 3 716 | 3 517 |
| Property, plant and equipment | 6 648 | 7 047 | 6 745 |
| Right-of-use assets | 266 | 438 | 357 |
| Investment property | 35 038 | 145 501 | 98 512 |
| Intangible assets | 354 | 354 | 375 |
| Total non-current assets | 42 329 | 157 056 | 109 506 |
| TOTAL ASSETS | 125 105 | 210 575 | 179 048 |
| LIABILITIES AND EQUITY | |||
| Current liabilities | |||
| Current debt | 1 262 | 83 162 | 107 581 |
| Customer advances | 13 070 | 6 059 | 7 866 |
| Current payables | 4 882 | 15 430 | 22 211 |
| Tax liabilities | 111 | 167 | 458 |
| Short-term provisions | 475 | 325 | 459 |
| Total current liabilities | 19 800 | 105 143 | 138 575 |
| Non-current liabilities | |||
| Long-term debt | 67 085 | 41 179 | 27 255 |
| Other non-current payables | 2 577 | 1 416 | 2 295 |
| Deferred income tax liabilities | 1 133 | 1 289 | 1 170 |
| Long-term provisions | 82 | 146 | 182 |
| Total non-current liabilities | 70 877 | 44 030 | 30 902 |
| TOTAL LIABILITIES | 90 677 | 149 173 | 169 477 |
| Equity attributable to owners of the Company | |||
| Share capital in nominal value | 11 338 | 11 338 | 11 338 |
| Share premium | 5 661 | 5 661 | 5 661 |
| Statutory reserve | 1 134 | 1 216 | 1 134 |
| Revaluation reserve | 2 984 | 3 262 | 2 984 |
| Retained earnings | -8 031 | 47 564 | 47 647 |
| Profit/ Loss for the period | 21 342 | -7 554 | -55 678 |
| Total equity attributable to owners of the Company | 34 428 | 61 487 | 13 086 |
| Non-controlling interest | 0 | -85 | -3 515 |
| TOTAL EQUITY | 34 428 | 61 402 | 9 571 |
| TOTAL LIABILITIES AND EQUITY | 125 105 | 210 575 | 179 048 |
* See Note 2 for details regarding restatement.
Consolidated interim statements of profit and loss and other comprehensive income
| in thousands of euros | 2021 6M | 2020 6M | 2021 Q2 | 2020 Q2 | 2020 12M | |||||
| CONTINUING OPERATIONS | ||||||||||
| Operating income | ||||||||||
| Revenue | 7 307 | 5 597 | 1 727 | 1 727 | 13 637 | |||||
| Cost of goods sold | -5 494 | -4 060 | -1 505 | -1 294 | -9 424 | |||||
| Gross profit | 1 813 | 1 537 | 222 | 433 | 4 213 | |||||
| Marketing expenses | -239 | -277 | -114 | -126 | -611 | |||||
| Administrative expenses | -2 463 | -2 118 | -1 470 | -1 024 | -4 372 | |||||
| Other income | 1 508 | 4 | 176 | 3 | 384 | |||||
| Other expenses | -49 | -12 | -28 | -2 | 2 876 | |||||
| Operating profit/ loss | 570 | -866 | -1 214 | -716 | 2 490 | |||||
| Financial income | 53 810 | 2 | 53 809 | 1 | 4 | |||||
| Financial expense | -27 753 | -2 817 | -26 362 | -1 203 | -5 419 | |||||
| Profit / loss before income tax | 26 627 | -3 681 | 26 234 | -1 918 | -2 925 | |||||
| Income tax | -28 | -79 | -11 | -10 | -354 | |||||
| Net profit / loss from continuing operations | 26 599 | -3 760 | 26 223 | -1 928 | -3 279 | |||||
| Profit from discontinued operations | -5 257 | -4 143 | -2 768 | -2 011 | -56 177 | |||||
| Net profit / loss for the period | 21 342 | -7 903 | 23 455 | -3 939 | -59 456 | |||||
| Attributable to: | ||||||||||
| Equity holders of the parent | 21 627 | -7 554 | 23 577 | -3 769 | -55 678 | |||||
| Non-controlling interest | -285 | -349 | -123 | -170 | -3 778 | |||||
| Other comprehensive income, net of income tax | ||||||||||
| Items that will not be reclassified subsequently to profit or loss | ||||||||||
| Net change in properties revaluation reserve | 0 | 0 | 0 | 0 | -278 | |||||
| Total comprehensive income / loss for the year | 21 342 | -7 903 | 23 455 | -3 937 | -59 734 | |||||
| Attributable to: | ||||||||||
| Equity holders of the parent | 21 627 | -7 554 | 23 577 | -3 769 | -55 956 | |||||
| Non-controlling interest | -285 | -349 | -123 | -170 | -3 778 | |||||
| Earnings per share (continuing operations) € | 0.47 | -0.07 | 0.46 | -0.03 | -0.06 | |||||
| Earnings per share for the period € | 0.38 | -0.13 | 0.41 | -0.07 | -0.99 | |||||
Consolidated interim statements of cash flows
| in thousands of euros | 2021 6M | 2020 6M | 2021 Q2 | 2020 Q2 | 2020 12M |
| Cash flows from operating activities | |||||
| Profit/loss for the period | 21 342 | -7 903 | 23 454 | -3 937 | -59 456 |
| Adjustments for: | |||||
| Depreciation, amortization of non-current assets | 194 | 208 | 94 | 104 | 416 |
| Gain from disposal of investment property | -1 092 | 0 | 0 | 0 | 0 |
| Loss from the write-off of plant, property, equipment | 0 | 0 | 0 | 0 | 8 |
| Change in fair value of property, plant, equipment | 0 | 0 | 0 | 0 | -16 |
| Change in fair value of investment property | 0 | 0 | 0 | 0 | 43 127 |
| Gain from derecognition of subsidiary | -53 808 | 0 | -53 808 | 0 | 0 |
| Finance income and costs | 33 314 | 8 074 | 29 321 | 3 831 | 15 994 |
| Changes in deferred tax assets and liabilities | -37 | -59 | -19 | -32 | -178 |
| Other non-monetary changes (net amounts) | 1 545 | 1 | 1 544 | 1 | -3 110 |
| Changes in working capital: | |||||
| Trade receivables and prepayments | 4 319 | -980 | 4 266 | -570 | -1 514 |
| Inventories | -9 616 | -4 350 | -6 487 | -5 053 | -13 011 |
| Liabilities and prepayments | 64 | 2 348 | -3 442 | 1 012 | 10 025 |
| Provisions | -100 | 19 | -113 | 10 | 59 |
| Net cash used in operating activities | -3 875 | -2 642 | -5 190 | -4 634 | -7 656 |
| Cash flows from investing activities | |||||
| Payments for property, plant and equipment | -34 | -12 | -6 | -3 | -94 |
| Payments for intangible assets | -5 | -2 | -3 | 0 | -43 |
| Payments for investment property | -246 | -397 | -36 | -95 | -844 |
| Proceeds from disposal of investment property | 2 000 | 0 | 0 | 0 | 0 |
| Change in cash from derecognition of subsidiary | -183 | 0 | -183 | 0 | 0 |
| Interests received | 1 | 2 | 0 | 0 | 1 |
| Net cash used in investing activities | 1 533 | -409 | -228 | -98 | -980 |
| Cash flows from financing activities | |||||
| Net proceeds from secured bonds | 0 | 28 500 | 0 | 0 | 28 500 |
| Redemption of convertible bonds | -84 | 0 | -15 | 0 | -33 |
| Repurchase of non-convertible bonds | 0 | -28 000 | 0 | 0 | -28 000 |
| Proceeds from borrowings | 12 411 | 2 857 | 6 573 | 2 757 | 14 410 |
| Repayment of borrowings | -2 865 | -656 | -8 | -8 | -1 376 |
| Repayment of lease liabilities | -87 | -84 | -41 | -36 | -135 |
| Interests paid | -2 584 | -3 121 | -580 | -379 | -5 953 |
| Net cash used/ generated by financing activities | 6 791 | -504 | 5 929 | 2 334 | 7 413 |
| Net change in cash and cash equivalents | 4 449 | -3 555 | 511 | -2 398 | -1 223 |
| Cash and cash equivalents at the beginning | 9 393 | 10 616 | 13 331 | 9 459 | 10 616 |
| Cash and cash equivalents at the end of the period | 13 842 | 7 061 | 13 842 | 7 061 | 9 393 |
The full report can be found in the notice published to the Stock Exchange.

