August 14, 2026
Pro Kapital Council approved Consolidated Interim Report for II Quarter and 6 Months of 2026 (Unaudited)
MANAGEMENT REPORT
Real Estate Development
Tallinn
In Kristiine City, the Uus-Kindrali development made solid progress in both sales and construction. As at the date of publication of this report, 90% of the sellable area in the white building (Talli 3 / Sammu 8) had been sold, with 12 apartments still available for sale.
Meanwhile, construction of the adjacent seven-storey black building at Sammu 10/Seebi 24a, comprising 90 apartments, also progressed well. By the end of the second quarter, construction was approximately 75% complete and remained on schedule for substantial completion in October–November 2026. By the date of publication, 43% of the apartments had been sold.
Sales and construction also continued at Musketäri Majad, a development launched in the first quarter of 2026. Located at Sammu 7, Talli 1 and Rivi 8, the project comprises two of six- and seven-storey buildings with a total of 144 apartments. During the second quarter, the Group began entering into notarised preliminary sale and purchase agreements. As at the date of publication of this report, 15% of the project’s total sellable area had been sold. In addition, a construction loan agreement was signed with Coop Pank.
Looking ahead, the Group continued to advance the next stages of its Kristiine City development portfolio through ongoing design and permitting activities for four additional projects submitted to the Tallinn City Planning Department. These developments are expected to add approximately 43,000 square metres of above- and below-ground gross building area and around 360 units. Approximately 95% of these units would be residential and 5% commercial. Among these projects, Tondi 53 (“Dunte”) has already obtained a building permit and completed the design phase. The project will comprise approximately 160 apartments in a historic building on Tondi Street.
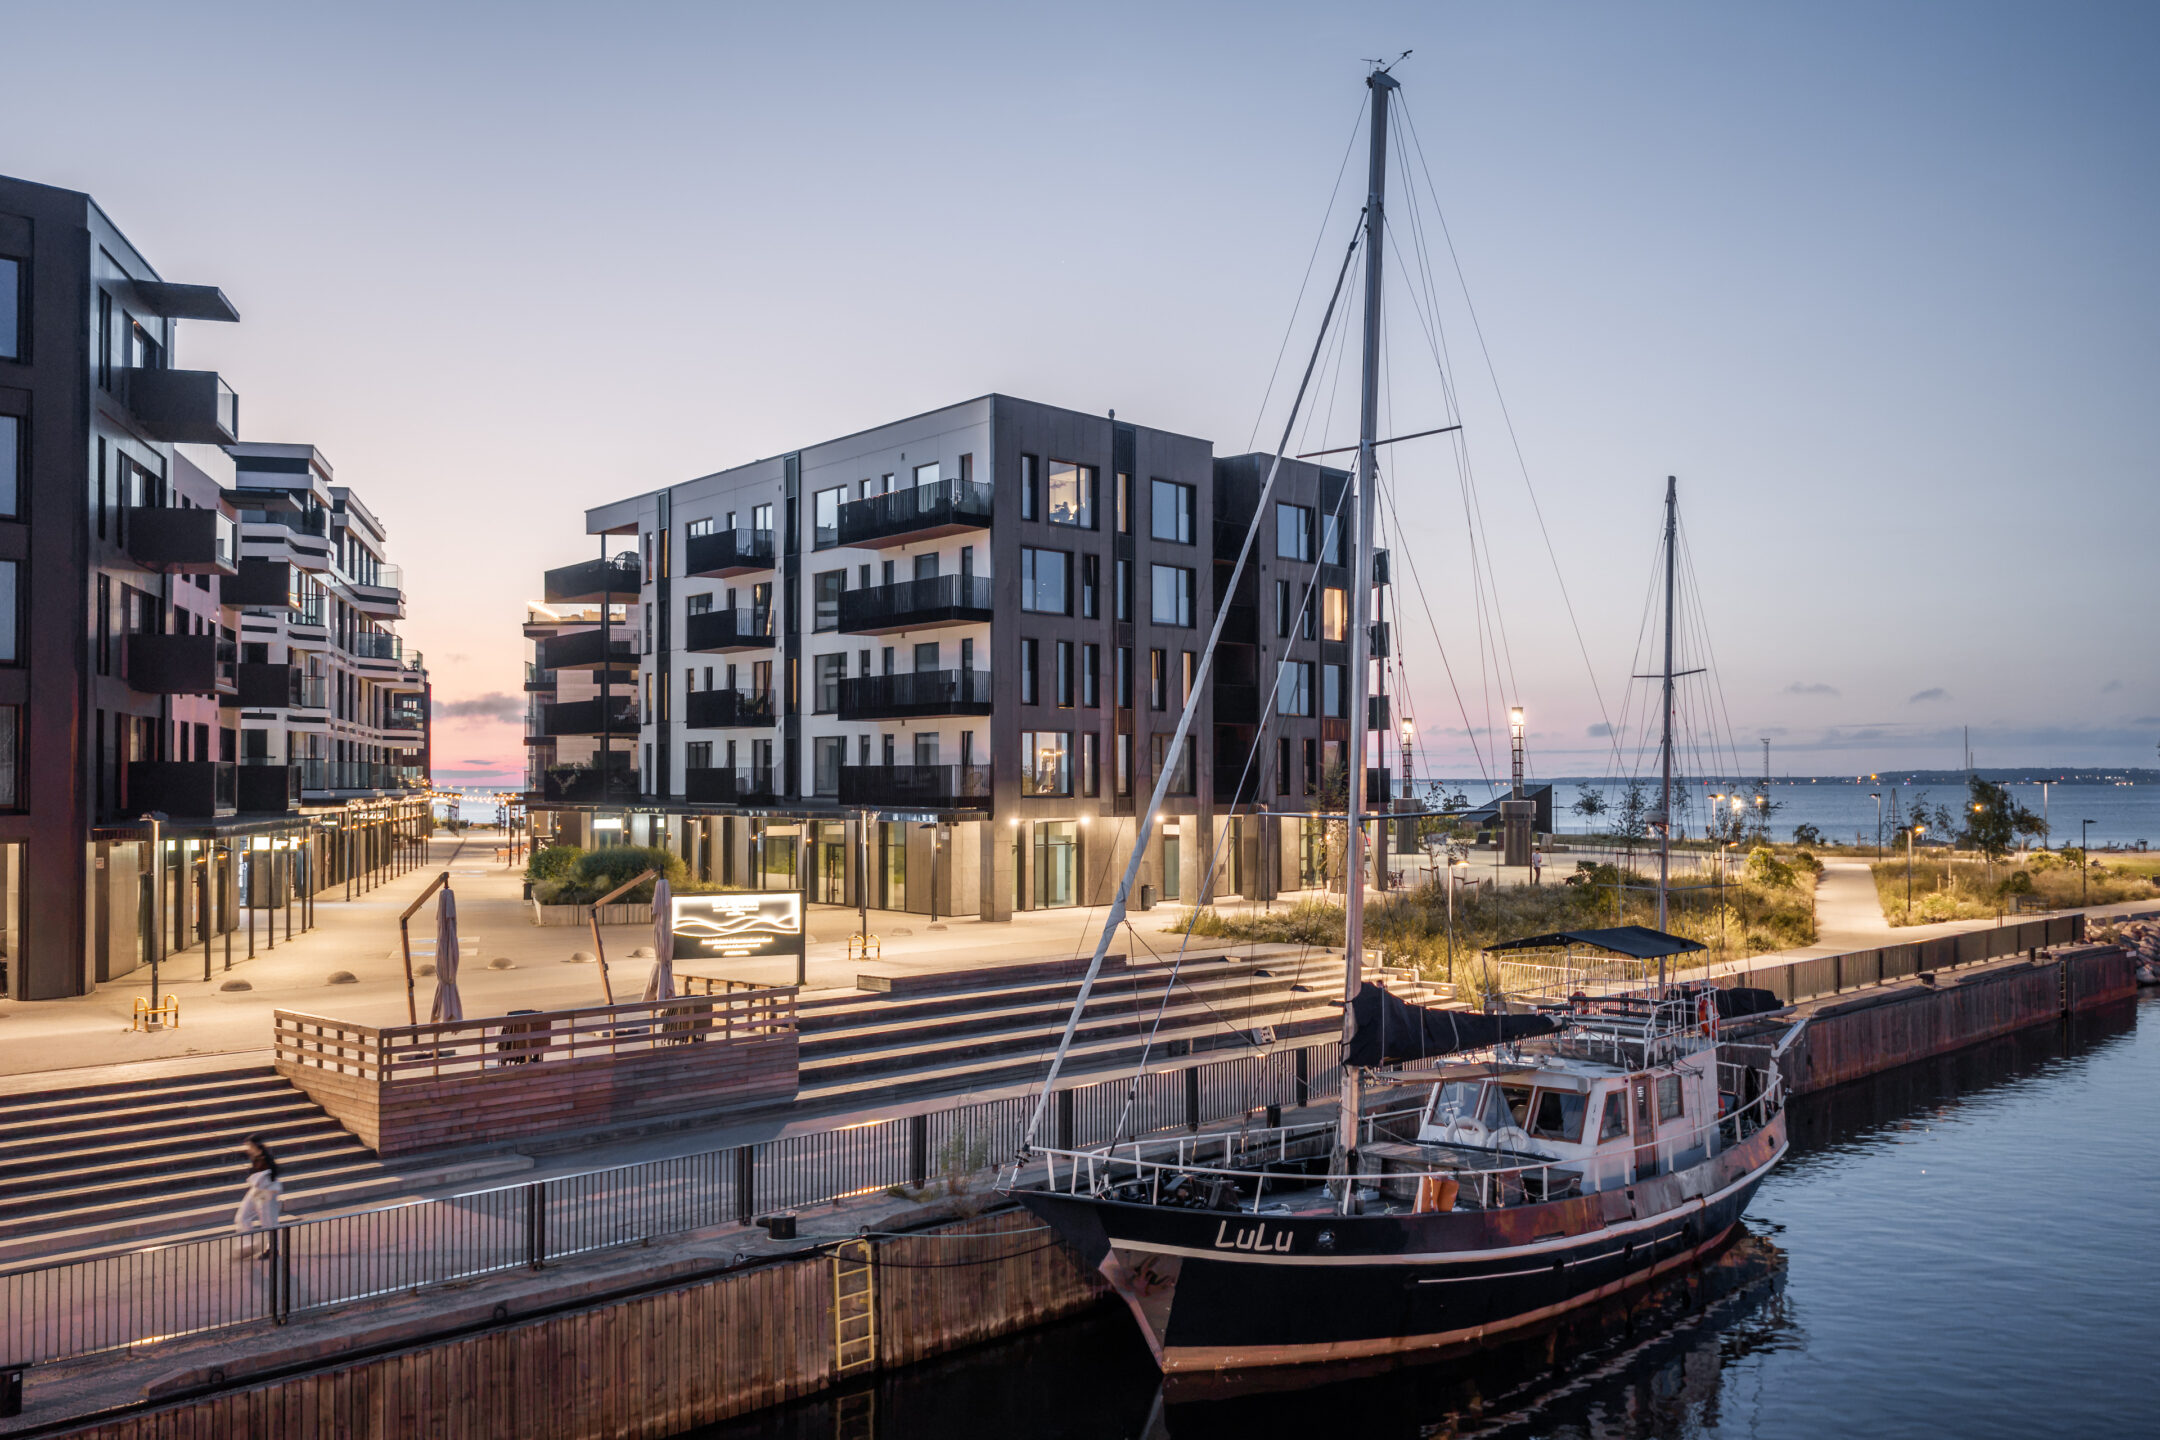
In the Kalaranna District, construction has been completed, while sales and marketing activities continue. As at the date of publication of this report, 88% of its 385 apartments had been sold, with 47 still available for sale.
Riga
In Riga, the Blue Marine Residence project progressed in line with plan. During the second quarter, construction works on the building’s underground structure were completed, and this milestone was marked by a symbolic time capsule ceremony. Preparations for the production of precast reinforced concrete structures for the above-ground section also continued. As part of the sales and marketing activities, a common brand, Klīversala Bay, was introduced for the entire development area.
Vilnius
In Vilnius, the Group maintained strong sales momentum at the Attico and City Villas. During the quarter, five apartments were notarised and one additional preliminary agreement was signed, bringing total sales across the two projects to 45.5% of the total sellable area.
City Villas continued to strengthen its position as one of Vilnius’s most exclusive residential developments. In June, two apartments with a combined area of 469 square metres were sold for more than EUR 4.44 million, setting a new record for the highest-value residential property transaction in Vilnius. The previous record had also been set by Pro Kapital at City Villas at the end of 2025.
The Group also progressed preparations for Borgo, its newest premium development in Vilnius Old Town, adjacent to the MO Museum. The project will transform a historic building into an exclusive residential development comprising approximately 50 apartments with panoramic views of the Old Town and the Sculpture Garden. The building permit has been obtained, and the official launch is planned for the second half of 2026.
Hotel operations
The hotel delivered the anticipated increase in revenue in the second quarter, with particularly strong results in May and June, driven by growing corporate demand for events and MICE services. As at the end of June, revenue was slightly below budget, while profitability showed a moderate improvement both against budget and year-on-year.
The outlook for the remainder of the year remains stable, although demand from individual leisure travellers has been softer this summer than in the previous year.
Other operations
The Group’s Italian operations, led by Preatoni Nuda Proprietà (PNP) and Preatoni Intermediazioni Immobiliari (PII), continued to operate in a challenging market environment during the first half of 2026. Efforts continued to refine the commercial model and advance the implementation of new AI-supported tools aimed at strengthening cooperation with local real estate agencies and improving operational scalability.
Conclusion
The second quarter of 2026 was a period of solid operational progress for the Group. Construction, sales and development planning advanced across all core markets, despite continued geopolitical uncertainty and persistent pressure on construction costs. The Group continued to advance the Kristiine City development in Tallinn and the Blue Marine Residence project in Riga, while maintaining strong sales momentum in Vilnius, where a new record was set for the city’s highest-value residential property transaction. The hotel achieved the anticipated seasonal improvement in revenue and profitability, while the Group’s Italian operations continued to refine their business model.
Alongside day-to-day delivery, management remained focused on preserving long-term value through disciplined project selection, controlled execution and careful capital allocation. Despite a macroeconomic environment that remains selective and, in certain segments, challenging, the Group continues to benefit from a geographically diversified portfolio, a recognised brand and a significant development pipeline with embedded future potential.
Looking ahead, management remains cautiously optimistic: the Group enters the remainder of 2026 with active construction sites, completed inventory available for monetisation, new developments approaching launch and a solid medium-term project pipeline across the Baltics and Italy.
On behalf of the Management Board, I would like to thank our employees, clients, investors and business partners for their continued trust and commitment.
Edoardo Axel Preatoni
CEO
Key financials
The total revenue of the Group for the first six months of 2026 was EUR 26.1 million, which decreased by EUR 2.4 million (9%) compared to the same period in 2025 (2025 6M: EUR 28.5 million). The total revenue of the second quarter was EUR 11.0 million compared to EUR 16.1 million in 2025.
Revenue from real estate sales is recognised at the moment when the notarial sales agreement is signed and legal title to the property is transferred to the buyer. Therefore, revenue from real estate sales is closely linked to the construction cycle and the timing of project completions.
During the first six months of 2026, the Group’s revenue was mainly supported by the handover of completed apartments in the Kalaranna District and Uus‑Kindrali developments in Tallinn, as well as in the City Villas and Attico building project in Vilnius.
Gross profit for the first six months of 2026 amounted to EUR 9.6 million comparedto EUR 10.2 million in the same period of 2025. The gross profit of the second quarter was EUR 3.9 million compared to EUR 6.0 million in 2025.
Operating profit reached EUR 5.6 million during the period (2025 6M: EUR 7.5 million). The operating profit of the second quarter was EUR 1.6 million compared to EUR 5.0 million in the second quarter of 2025.
The Group’s net profit for the first six months of 2026 was EUR 3.3 million, compared to EUR 6.2 million in the reference period. The net profit of the second quarter was EUR 0.5 million compared to EUR 4.3 million in the same period of 2025.
Cash generated from operating activities during the first six months of 2026 amountedto EUR 9.3 million, compared with EUR 8.5 million in the same period of 2025. Cash used in operating activities during the second quarter was EUR 0.8 million compared to EUR 7.2 million generated in the second quarter of 2025.
Net asset value per share were EUR 1.17 as at 30 June 2026 (30 June 2025: EUR 1.01).
Key performance indicators
| in thousands of euros | 2026 6M | 2025 6M | 2026 Q2 | 2025 Q2 | 2025 12M |
| Revenue | 26 087 | 28 519 | 11 033 | 16 069 | 53 162 |
| Gross profit | 9 561 | 10 233 | 3 901 | 6 026 | 18 795 |
| Gross profit, % | 37% | 36% | 35% | 38% | 35% |
| Operating profit | 5 556 | 7 517 | 1 579 | 4 975 | 14 733 |
| Operating profit, % | 21% | 26% | 14% | 31% | 28% |
| Net profit (incl. non-controlling interests) | 3 305 | 6 188 | 493 | 4 298 | 12 041 |
| Net profit (incl. non-controlling interests), % | 13% | 22% | 4% | 27% | 23% |
| Net profit (owners’ share) | 3 429 | 6 342 | 561 | 4 347 | 12 314 |
| Earnings per share (owners’ share), EUR | 0.06 | 0.11 | 0.01 | 0.08 | 0.22 |
| in thousands of euros | 30.06.2026 | 30.06.2025 | 31.12.2025 |
| Total Assets | 123 651 | 115 759 | 124 490 |
| Total Liabilities | 57 019 | 58 350 | 61 163 |
| Equity (incl. non-controlling interests) | 66 632 | 57 409 | 63 327 |
| Equity (owners’ share) | 66 575 | 56 975 | 63 146 |
| Equity ratio, % | 53.8% | 49.2% | 50.7% |
| Debt to equity ratio, % | 57.2% | 70.0% | 68.7% |
| Return on assets, % | 2.9% | 5.5% | 9.9% |
| Return on equity, % | 5.6% | 11.7% | 21.6% |
| Current ratio | 3.04 | 2.91 | 1.56 |
| Net asset value per share, EUR | 1.17 | 1.01 | 1.11 |
Equity ratio = total assets / equity (owners’ share)
Debt to Equity ratio = interest-bearing liabilities/ equity (owners’ share)
Return on assets = net profit (owners’ share) / average total assets
Return on equity = net profit (owners’ share) / average equity (owners’ share)
Current ratio = current assets / current liabilities
Net asset value per share = equity (owners’ share) / number of shares
CONSOLIDATED INTERIM FINANCIAL STATEMENTS
Consolidated interim statement of financial position
| in thousands of euros | 30.06.2026 | 30.06.2025 | 31.12.2025 | |
| ASSETS | ||||
| Current assets | ||||
| Cash | 6 126 | 3 572 | 5 143 | |
| Current receivables | 4 373 | 783 | 5 645 | |
| Prepayments | 1 785 | 712 | 287 | |
| Inventories | 63 281 | 57 030 | 57 503 | |
| Total current assets | 75 565 | 62 097 | 68 578 | |
| Non-current assets | ||||
| Non-current receivables | 13 | 314 | 324 | |
| Property, plant and equipment | 9 061 | 7 463 | 7 836 | |
| Right-of-use-assets | 782 | 384 | 781 | |
| Investment property | 35 347 | 42 505 | 43 516 | |
| Goodwill | 0 | 863 | 0 | |
| Intangible assets | 983 | 2 133 | 1 555 | |
| Total non-current assets | 46 186 | 53 662 | 54 012 | |
| Assets held for sale | 1 900 | 0 | 1 900 | |
| Total assets held for sale | 1 900 | 0 | 1 900 | |
| TOTAL ASSETS | 123 651 | 115 759 | 124 490 | |
| LIABILITIES AND EQUITY | ||||
| Current liabilities | ||||
| Current debt | 9 738 | 7 284 | 30 046 | |
| Customer advances | 5 175 | 7 525 | 5 888 | |
| Trade and other payables | 7 235 | 6 010 | 5 447 | |
| Tax payables | 2 560 | 471 | 2 562 | |
| Short-term provisions | 168 | 16 | 116 | |
| Total current liabilities | 24 876 | 21 306 | 44 059 | |
| Non-current liabilities | ||||
| Non-current debt | 30 385 | 34 966 | 15 053 | |
| Other non-current payables | 8 | 6 | 8 | |
| Deferred income tax liabilities | 1 459 | 1 869 | 1 813 | |
| Long-term provisions | 291 | 203 | 230 | |
| Total non-current liabilities | 32 143 | 37 044 | 17 104 | |
| TOTAL LIABILITIES | 57 019 | 58 350 | 61 163 | |
| Equity attributable to equity holders of the parent | ||||
| Share capital in nominal value | 11 338 | 11 338 | 11 338 | |
| Share premium | 5 661 | 5 661 | 5 661 | |
| Statutory reserve | 1 134 | 1 134 | 1 134 | |
| Revaluation surplus | 2 322 | 1 977 | 2 322 | |
| Retained earnings | 46 120 | 36 865 | 42 691 | |
| Total equity attributable to equity holders of the parent | 66 575 | 56 975 | 63 146 | |
| Non-controlling interest | 57 | 434 | 181 | |
| TOTAL EQUITY | 66 632 | 57 409 | 63 327 | |
| TOTAL LIABILITIES AND EQUITY | 123 651 | 115 759 | 124 490 | |
Consolidated interim statements of comprehensive income
| in thousands of euros | 2026 6M | 2025 6M | 2026 Q2 | 2025 Q2 | 2025 12M |
| CONTINUING OPERATIONS | |||||
| Operating income | |||||
| Revenue | 26 087 | 28 519 | 11 033 | 16 069 | 53 162 |
| Cost of sales | -16 526 | -18 286 | -7 132 | -10 043 | -34 367 |
| Gross profit | 9 561 | 10 233 | 3 901 | 6 026 | 18 795 |
| Marketing expenses | -651 | -626 | -357 | -340 | -1 213 |
| Administrative expenses | -3 379 | -2 752 | -1 959 | -1 426 | -5 659 |
| Other operating income | 76 | 770 | 32 | 758 | 3 824 |
| Other operating expenses | -51 | -108 | -38 | -43 | -1 014 |
| Operating profit | 5 556 | 7 517 | 1 579 | 4 975 | 14 733 |
| Finance income | 17 | 23 | 7 | 10 | 40 |
| Finance cost | -1 300 | -1 514 | -662 | -769 | -2 615 |
| Profit before income tax | 4 273 | 6 026 | 924 | 4 216 | 12 158 |
| Income tax | -968 | 162 | -431 | 82 | -117 |
| Profit for the period | 3 305 | 6 188 | 493 | 4 298 | 12 041 |
| Attributable to: | |||||
| Equity holders of the parent | 3 429 | 6 342 | 561 | 4 347 | 12 314 |
| Non-controlling interest | -124 | -154 | -68 | -49 | -273 |
| Other comprehensive income | |||||
| Items that will not be reclassified subsequently to profit or loss | |||||
| Net change in asset revaluation reserve | 0 | 0 | 0 | 0 | 345 |
| Other comprehensive income for the period | 0 | 0 | 0 | 0 | 345 |
| Total comprehensive income for the period | 3 305 | 6 188 | 493 | 4 298 | 12 386 |
| Attributable to: | |||||
| Equity holders of the parent | 3 429 | 6 342 | 561 | 4 347 | 12 659 |
| Non-controlling interest | -124 | -154 | -68 | -49 | -273 |
| Earnings per share (Basic) EUR | 0.06 | 0.11 | 0.01 | 0.08 | 0.22 |
The full report can be found here.
Ann-Kristin Kuusik
CFO
+372 614 4920
prokapital@prokapital.ee